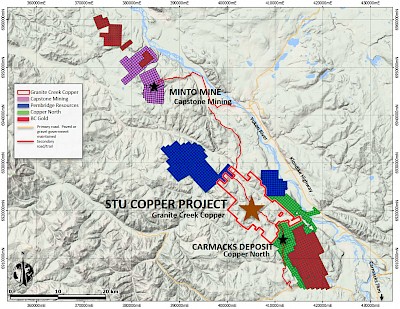
 The Stu property lies on strike between, and displays the same style of mineralization as, the two significant mineral properties in the Minto Copper Belt: Pembridge Resources’ Minto mine and Copper North Mining Corp’s advanced Carmacks Copper Project.
The Stu property is along a continuum of mineralization from the flat-lying sulphide dominant deposit at Minto to the near vertical, oxide-dominated deposit at Carmacks.
The Minto Mine is located 30km north of the Stu Project and the deposit is spread over a series of high-grade areas interspersed with large deposits of low-grade material. The mine started development in February 2006 as an open-pit operation and added underground development in September 2012. Estimated mineral reserves and resources as at December 31, 2017 are listed in the tables below. The Minto mine returned to production in Q4 2019.
Table 1 - Minto Mine Mineral Reserves
|
Classification |
Tonnes (kt) |
Copper (%) |
Silver (g/t) |
Gold (g/t) |
Contained Copper (kt) |
Contained Silver (koz) |
Contained gold (koz) |
|
Proven |
469 |
1.02 |
3 |
0.25 |
5 |
46 |
3.8 |
|
Probable |
2,975 |
1.69 |
5 |
0.63 |
50 |
507 |
60.7 |
|
Total Mineral Reserves |
3,444 |
1.60 |
5 |
0.58 |
55 |
553 |
64.4 |
Table 2 - Minto Mine Mineral Resources
|
Classification |
Tonnes (kt) |
Copper (%) |
Silver (g/t) |
Gold (g/t) |
Contained Copper (kt) |
Contained Silver (koz) |
Contained gold (koz) |
|
Total Measured Resources |
3,904 |
1.19 |
3 |
0.38 |
46 |
422 |
47.9 |
|
Total Indicated Resources |
12,644 |
1.48 |
5 |
0.60 |
188 |
2,080 |
424.4 |
|
Total Measured + Indicated |
16,548 |
1.42 |
5 |
0.55 |
234 |
2,502 |
290.3 |
|
Total Inferred Resources |
6,147 |
1.42 |
5 |
0.51 |
87 |
962 |
100.4 |
Mineral Reserves and Resources are reported as at December 31, 2017 above a 0.5% Cu cut-off grade for potential open-pit scenarios and above a 1.0% Cu cut-off grade for underground mining scenarios. Stockpiles are treated as Measured Mineral Resources. Mineral Resources are not Mineral Reserves and do not have demonstrated economic viability.
Directly adjoining the southern claims of the Stu Project is Copper North Mining Corp’s Carmacks Project.
Table 3 - Carmacks Copper Project Mineral Resources
|
Zone |
Resource domain |
Class |
Tonnage (t) |
Total Cu (%) |
Acid-soluble Cu (%) |
Au (g/t) |
Ag (g/t) |
Sulphide Cu (%) |
|
Total Mineral Resource for zones 1, 4, 7, 7A, 12, 13 and 2000S |
Oxide and Transition resources |
Measured |
6,484,040 |
0.86 |
0.69 |
0.414 |
4.235 |
0.17 |
|
Indicated |
9,206,343 |
0.97 |
0.77 |
0.357 |
3.796 |
0.20 |
||
|
ME + IN |
15,690,383 |
0.94 |
0.74 |
0.379 |
3.971 |
0.20 |
||
|
Inferred |
912,614 |
0.45 |
0.30 |
0.119 |
1.900 |
0.15 |
||
|
Sulphide Mineral resources |
Measured |
1,381,329 |
0.64 |
0.05 |
0.185 |
2.166 |
0.59 |
|
|
Indicated |
6,686,922 |
0.69 |
0.04 |
0.172 |
2.344 |
0.65 |
||
|
ME + IN |
8,068,252 |
0.68 |
0.05 |
0.178 |
2.332 |
0.65 |
||
|
Inferred |
8,406,835 |
0.63 |
0.03 |
0.150 |
1.994 |
0.61 |
References to adjoining properties are for illustrative purposes only and are not necessarily indicative of the exploration potential, extent or nature of mineralization or potential future results of the Company’s projects.
____________________________________________________________________________________________________
STU COPPER PROJECT MINERALIZED ZONES
Zone A
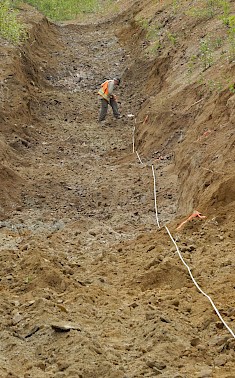
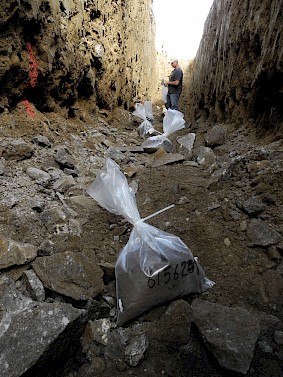 Zone A in the centre of the property is the largest zone and has had the most work done; bulldozer trenching and diamond drilling. The underlying soil anomaly is 2 km long, stretching north of the trenches.
In 2015, three old trenches were deepened, and two new trenches were dug over a 350m area at the north end of the zone. Surface work has confirmed 350m of mineralization from trench 400W to trench 2015A. Mineralization is open ended and further trenching (infill trenches, deepening old trenches and extending old trenches) is required to extend the mineralization to the 1 km extent reported in historic reports.
Copper grades of 2.8 to 3.5% were returned over 12 to 14m widths in drill core (widths are reported sample lengths from composite samples and the true thickness is unknown). On surface, Cu grades over similar widths are less than 0.4%. A similar relationship is seen with Ag and Au. Increased amounts of bornite and chalcopyrite below the oxidized layer may account for the higher subsurface grades when compared to surface grades.
Zone B
Zone B has the most rock exposure and the largest mapped extent of foliated and gneissic granodiorite of the three zones. Mineralization is locally high grade over narrow widths and limited percussion drilling did not show consistency below surface. A sample collected from Trench B1 in 2013 ran >1% Cu, 14.8 g/t Ag and 0.553 g/t Au over 0.5m (the sample was overlimit for Cu, but not assayed), and a sample from Trench B3 ran 0.55% Cu and 4.4 g/t Ag over 2m. In 2015 selected trenches were deepened and 2 new trenches were dug. Zone B may be down dropped and potentially rotated from Zones A and C, exposing a higher level of the mineralized system, prone to more oxidation and migration of copper minerals like Carmacks Copper.
Zone C
Zone C was first discovered by Hudson’s Bay in 1971 as a copper in soil anomaly coincident with electromagnetic anomalies. It shows 110m of mineralization between trenches 9+50E and 14+50E reaching a width of 25-30m in trench 14+50E. The zone is open at both ends. Mineralization is significant with values up to 1.59% Cu and 3.7 g/t Au along northwest trending fractures.
 Prior to trenching, there were 2 separate showings of malachite in Zone C, one at the northwest end measuring 150m by 60m and a smaller showing 30m by 45m at the southeast end close to Camp Creek. The dominant host rock in the northwest showing is a medium grained quartz-feldspar biotite gneiss with >50% mafic zones. At the southeast showing, malachite is hosted in a strongly foliated, fine-grained granitoid. Three trenches over 350m of strike length were excavated in 1979 over the northwest showing, but none over the southeast showing. No results are available and no new trenching has been done in this zone. Three holes were drilled in 1980 but did not intersect mineralization. All holes were drilled to the southeast, which may be parallel to the orientation of the foliated zones.
This zone has received the least work of the three; there are only 4 trenches and the second outcrop showing near Camp Creek does not appear to have been trenched. Although small the zone has high copper values along with gold up to 3.7 g/t (sample 526140) and silver up to 15.09 g/t (historic sample 2512). Repeated rock sampling in trenches 11+50E and 14+50E has returned samples in the 0.3-1.6% copper range. UKHM mapping shows that foliated granodiorite continues either side of the trenched area.
See NATIONAL INSTRUMENT 43-101 TECHNICAL REPORT On the Stu Copper Property Report Prepared by: Deborah James, B.Sc. P.Geo. Consulting Geologist and dated November 15, 2018.